Upward Mobility In the U.S
If you want your child to have a shot at entering a higher tier of the socioeconomic echelon, you might not want to settle down in the South. It’s not so much about big or small cities as it is, well, segregation.
![]()
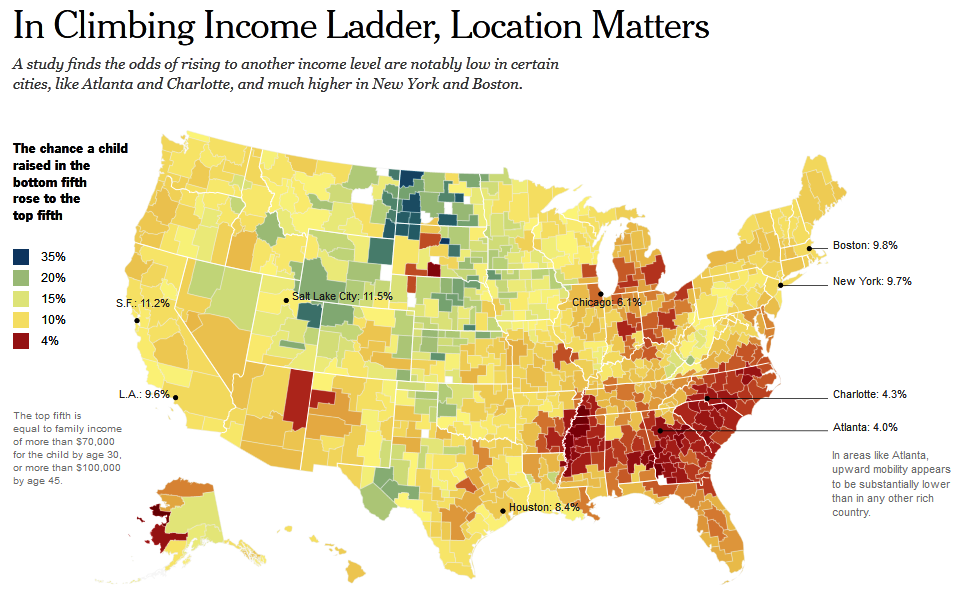
If you want your child to have a shot at entering a higher tier of the socioeconomic echelon, you might not want to settle down in the South. It’s not so much about big or small cities as it is, well, segregation.
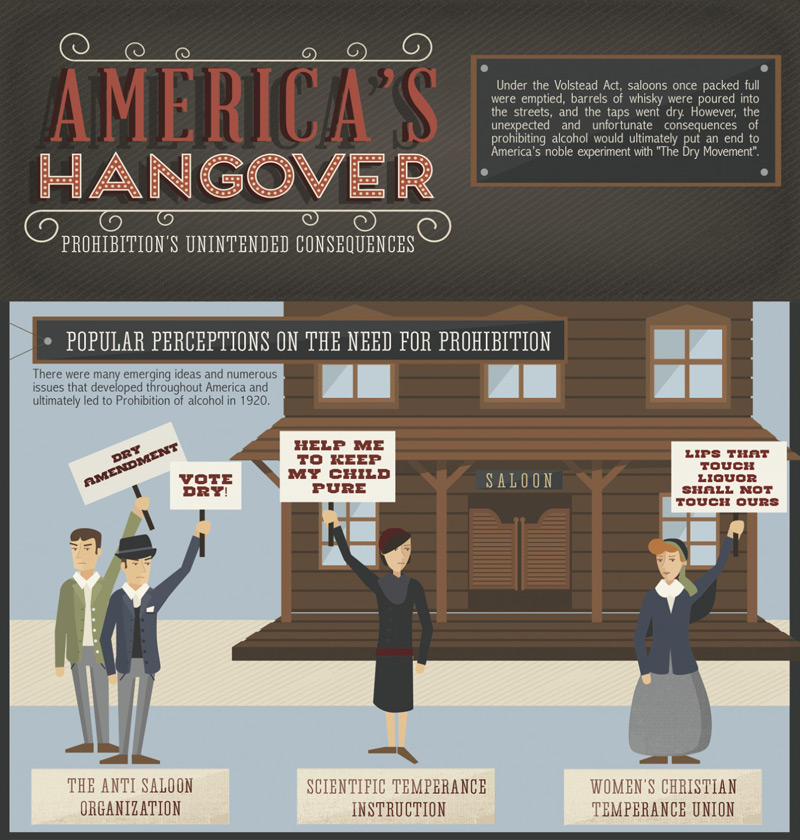
The 13 years of Prohibition were some of the worst this country has seen in terms of crime and corruption. Not to mention it was tough to find an affordable drink.
Learn all about the problems that arose from this dark era so you can tear apart the arguments of any teetotalers. Then celebrate your newfound knowledge with a drink, just because you can, dammit.
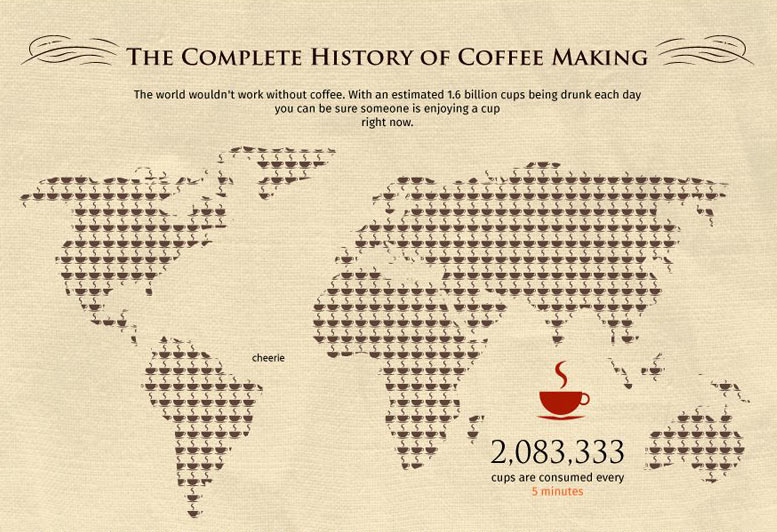
Today’s infographic gives us a look at the history of America’s favorite pick-me-up: coffee. An estimated 1.6 billion cups of coffee are enjoyed around the world each day. This infographic shows a pleasantly structured historical timeline of the process of coffee making and some of the people involved.

It’s no secret that New York City is one of the most expensive places to live in around the world.
We’re not going to say we were shocked by these statistics, but we will say that there is quite a difference as far as numbers are concerned. Check out the infographic below and see for yourself!
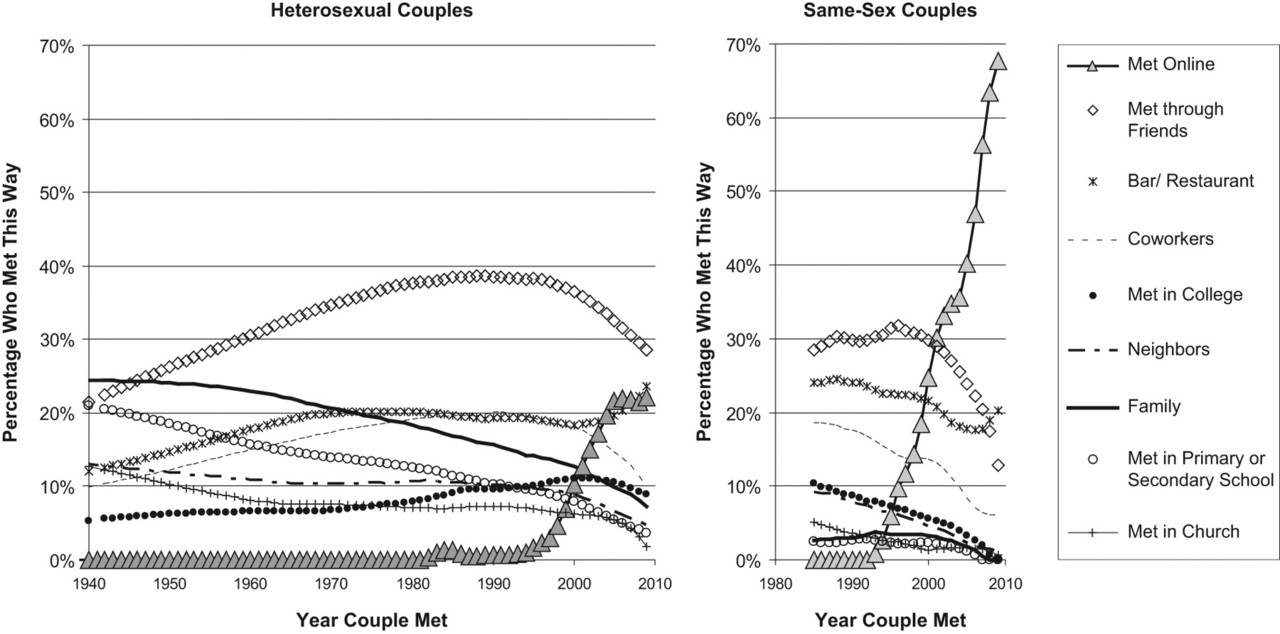
In an increasingly mobile and rootless society, a few things have happened. The first is that everything–even something as intimate as romance–can be commoditized. The second is the notion that “high school sweethearts” are on their way toward becoming fossils, perhaps to be replaced by internet cyber-sweeties.
Check out this fact-filled and concise infographic. From 7000 BC through today, the history and use of masks by all different cultures is covered.